JavaScript is not currently enabled, but is required for full CodeSonar manual search and browse functionality.
If you are viewing this file in your hub's Web GUI, enable JavaScript in your browser: you will also need it for GUI functionality.
If you opened this file directly from disk, your browser may be directly suppressing JavaScript functionality: certain browsers perform this suppression on local files (but not files delivered by web servers) for security reasons.
| CodeSonar® 9.2p0 | CONFIDENTIAL | CodeSecure Inc |
This page displays information about a CodeSonar analysis:
Several operations can be carried out on this page:
Analysis pages are also used to report the results of dry runs.
The Analysis page is available for all analyses, independent of the language or languages involved.
Important Note: the CodeSonar Web GUI makes extensive use of JavaScript. Make sure JavaScript is enabled in your web browser.
The Analysis page can be reached in any of the following ways.
| From Analysis Cloud Active Jobs | Click on a row in the table of processes to navigate to the corresponding Analysis page. | ||||||
|---|---|---|---|---|---|---|---|
| From Home or Project Search Results or Project Tree |
Click on a project name in the project table to navigate to
the Analysis page for the most recent CodeSonar analysis of the
project. (Note that if the hub analysis settings have been changed from the defaults, this may instead navigate to the Project page for the project.) |
||||||
| From Project or Analysis Search Results |
Click on a row in the analysis table to navigate to the corresponding Analysis page. | ||||||
| From Source Listing |
Click the analysis name in the breadcrumbs.
If the Analysis: Files tab is an establishing page for a file browse sequence, each Source Listing page that belongs to the sequence will also provide a browse sequence navigation link to that tab. |
||||||
| From Warning Report |
Click the analysis name in the breadcrumbs.
If the Analysis: Warnings tab is an establishing page for a warning browse sequence, each Warning Report page that belongs to the sequence will also provide a browse sequence navigation link to that tab. |
||||||
| By URL |
Depends on the page tab selected:
|
See Tab Properties entries for individual tabs:
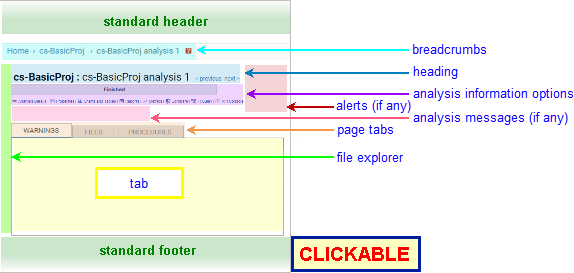
The following annotated screenshot shows the various parts of an Analysis page.
| Standard Header | See GUI Reference: Standard Header. | |||||||||||||||||||||||||||||
|---|---|---|---|---|---|---|---|---|---|---|---|---|---|---|---|---|---|---|---|---|---|---|---|---|---|---|---|---|---|---|
| Breadcrumbs |
Home > [Other_ProjectTree_Ancestors >]
Project_Name > Analysis_Name where
|
|||||||||||||||||||||||||||||
| Page Heading |
Project_Name : Analysis_Name The heading line includes < previous and next > links. These allow forward and backward navigation through the chronologically ordered Analysis pages for Project_Name.
|
|||||||||||||||||||||||||||||
| Analysis Information Options | Further information about the analysis is provided by the Analysis State progress bar along with eight information sections: Analysis Details, Properties, Charts and Tables, Reports, Metrics, Compare, and API Console (where available). | |||||||||||||||||||||||||||||
| Analysis State |
A progress bar showing the current analysis
state and the estimated time to completion (unless it is
finished).
|
|||||||||||||||||||||||||||||
| Analysis Details |
Click for general details about the analysis.
|
|||||||||||||||||||||||||||||
| Properties |
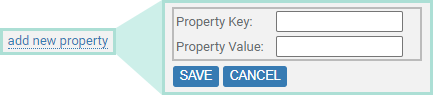
Click the link to expand the Properties section.
If no user-assigned properties have been associated with the analysis, the Properties section contains only an add new property link as shown above. Otherwise, the current properties are also shown, with edit and delete links:
If a property value contains a URL, the URL is displayed as a hyperlink. |
|||||||||||||||||||||||||||||
| Charts and Tables |
Click the link to expand the Charts and Tables section.
|
|||||||||||||||||||||||||||||
| Reports |
Click the link to expand the Reports section.
|
|||||||||||||||||||||||||||||
| Metrics |
Click the link to expand the Metrics section.
|
|||||||||||||||||||||||||||||
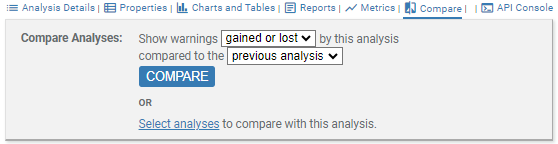
| Compare |
Click the link to expand the Compare Analyses section.
This section provides options for comparing the sets of warnings issued by two or more analyses. The Show warnings ... by this analysis dropdown menu has three options. Select the type of comparison in this menu.
The compared to the ... analysis dropdown menu has two options. Select the analysis to be compared against in this menu.
Select analyses: if you want to compare against an analysis other than the previous or next analysis, or compare against two or more other analyses, you will need to specify which analyses to include. Note, this comparison uses the gained or lost behavior, and is carried out by executing a search where the query is of the form
(aid:A1
UNION aid:A2
UNION ...
UNION aid:An)
DIFFERENCE (aid:A1
INTERSECT aid:A2
INTERSECT ...
INTERSECT aid:An)
for Analysis
IDs A1..An.See selecting analyses for comparison below for details. Analysis comparison results are displayed in a Warning Search Results page with the following properties.
|
|||||||||||||||||||||||||||||
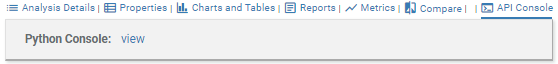
| API Console |
[Only available if WEB_CONSOLE=Yes
for this analysis. ] Click for a link to the Python Console.
|
|||||||||||||||||||||||||||||
| Alerts |
Any alerts that have been issued
for the build/analysis. Click on an alert for full information
about the problem and how to resolve it.
|
|||||||||||||||||||||||||||||
| Analysis Messages |
Any messages that have been issued for the build/analysis.
There are two message types.
|
|||||||||||||||||||||||||||||
| File Explorer | See below. | |||||||||||||||||||||||||||||
| Page Tabs |
The Analysis page has three tabs, each of which has its own
entry in the GUI reference:
|
|||||||||||||||||||||||||||||
| Standard Footer | See GUI Reference: Standard Footer. | |||||||||||||||||||||||||||||
Follow these steps to change the Analysis or Analysis Description. This requires ANALYSIS_READ and ANALYSIS_WRITE permission for the analysis.
![]()
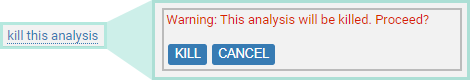
If the analysis is still running you can terminate it, leaving the analysis in Stalled state. This requires ANALYSIS_TERMINATE permission for the analysis.
Follow these steps to remove all information related to the analysis from the hub database. This requires ANALYSIS_READ, ANALYSIS_DELETE, and ANALYSIS_TERMINATE permission for the analysis.
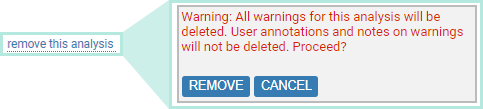
Removing an analysis will also remove its logs, but will not remove the project analysis directory.
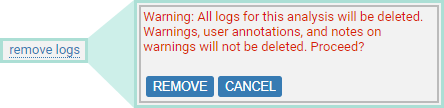
Follow these steps to remove all logs for the analysis from the hub database. All other analysis information will remain intact. You may wish to do this if you are trying to reduce the size of the hub database and do not anticipate any future need for any information in the logs from this analysis. If an analysis is still running when you remove its logs, any further log information that is submitted to the hub by that analysis will be ignored. This requires ANALYSIS_READ and ANALYSIS_DELETE permission for the analysis.
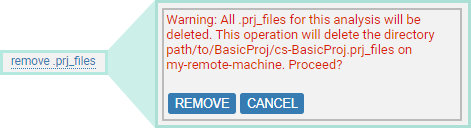
Follow these steps to remove the project analysis directory (pfilesname.prj_files/) from the analysis machine. Analysis information stored on the hub will remain intact. You may wish to do this if you are trying to make space available on the analysis machine and do not anticipate any future need for any information from the project analysis directory. In particular, do not remove the project analysis directory if you want to preserve access to any of the following.
Removing the project analysis directory requires ANALYSIS_READ, ANALYSIS_DELETE and ANALYSIS_TERMINATE permission for the analysis.
The analysis launch daemon must be running in order to delete the project analysis directory. If that launch daemon is currently offline, the deletion will be delayed until it is online again.
For dry runs:
The value of <num> reflects the additional cost that would be incurred if the project (as of the time of the dry run) were analyzed "now", where "now" is the time at which the Analysis page for the dry run was served by the hub. Since different versions of the project may subsequently be analyzed on the hub, <num> can decrease over time.
The File Explorer allows you to restrict the contents of any Analysis page tab to a single source file or directory tree. This restriction is applied in addition to any constraints arising from the current visibility filter selection.
In its collapsed state, the File Explorer is indicated by a shaded bar at the left of the page.
Click on a file or directory name to select it. The tab contents will update automatically, and your selection will be highlighted in the File Explorer panel.
In the following annotated screenshot, the user has clicked on include.

| expanding | To expand the File Explorer from its collapsed state, click the shaded bar. |
|---|---|
| resizing | To resize, drag on the right edge of the File Explorer. |
| collapsing | To collapse it from its expanded state, drag the right edge to narrow the File Explorer until the shaded bar reappears. |
You can add, remove, or edit the user-assigned properties associated with the analysis.
Follow these steps to associate a new user-assigned analysis property with the analysis.
The Property Key is the "name" of the property. For example, you might have a property with key "commit" to store the information about which Git commit corresponds to the analysis.
The set of all property keys on the hub is visible to all users, but the set of property keys and values for a specific analysis is only visible to users with ANALYSIS_READ permission for that analysis.
Follow these steps to remove one of the user-assigned analysis properties.
Follow these steps to change the value of one of the user-assigned analysis properties (see note).
![]()
Note: If you want to adjust the key associated with a property you will need to add a new property with the new key and appropriate value, then remove the property with the old key.
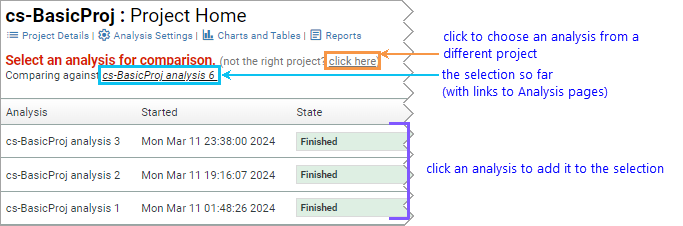
The compare with previous analysis and compare with next analysis links provide direct shortcuts to analysis comparison results. If you want to compare the results of this analysis with some other analysis or analyses, you can construct a comparison query as follows.
CodeSonar will display the Project page for the project analyzed by this analysis, augmented with functionality for selecting analyses for comparison.

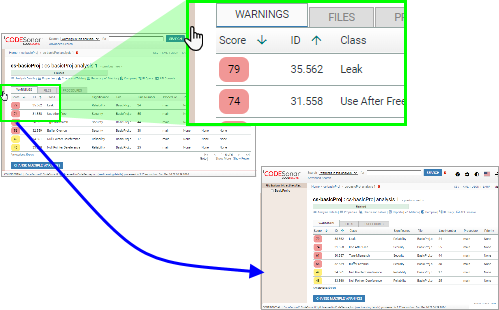
| view the analysis warnings, files, or procedures | Select the appropriate page tab. Note that each tab provides additional navigation functionality. |
|---|---|
| compare the analysis results against one or more other analyses | Expand the Compare section, then select the desired comparison link. |
| create a metric report for this analysis | Expand the Metrics section, then select create new report. |
| view a shortcut metric report for this analysis | Expand the Metrics section, then select the desired report link. |
| view a shortcut metric chart for this analysis | Expand the Metrics section, then select the desired chart link. |
| view a shortcut warning table or chart for the analysis | Expand the Charts and Tables section, then select the desired chart or table link. |
| view the analysis build, parse, or analysis log | Expand the Analysis Details section, then select the desired log from the list of links. |
| view parent project information | Click on the project name in the page breadcrumbs. |
| view ancestor project tree information | Click on the project tree name in the page breadcrumbs. |
| remove the analysis | Click on Remove this analysis and proceed as described above. |
To report problems with this documentation, please visit https://support.codesecure.com/.

 to navigate to
the
to navigate to
the