JavaScript is not currently enabled, but is required for full CodeSonar manual search and browse functionality.
If you are viewing this file in your hub's Web GUI, enable JavaScript in your browser: you will also need it for GUI functionality.
If you opened this file directly from disk, your browser may be directly suppressing JavaScript functionality: certain browsers perform this suppression on local files (but not files delivered by web servers) for security reasons.
| CodeSonar® 9.2p0 | CONFIDENTIAL | CodeSecure Inc |
Every chart has an equivalent chart table, and vice versa.
Charting is available for all analyses, regardless of the language or languages involved. However, charts and tables of procedure data will only include data from C/C++, C#, and Java code: procedure information is not available for other languages.
Several page types in the CodeSonar web GUI contain shortcut links to summary charts and chart tables, as well as to the charting wizard.
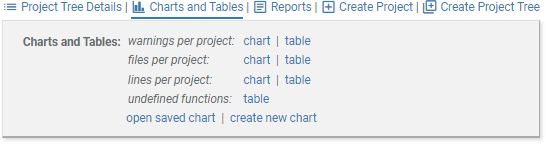
The Home and Project Tree pages have table and chart shortcut links under Charts and Tables:
| warnings per project |
Shows the number of warnings issued for the most recent
analysis of each project on the hub, subject to the Visible Warnings setting.
Projects that have no visible warnings are not shown.
The chart is a bar chart.
The table has one row per project, with two columns: Project Name and Number of Warnings. Click on any bar in the chart, or any line in the table, to navigate to a warning search results page listing the corresponding warnings. |
|---|---|
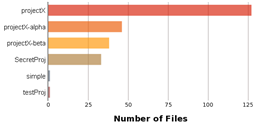
| files per project |
Shows the number of files analyzed in the most recent analysis
of each project on the hub.
The chart is a bar chart.
The table has one row per project, with two columns: Project Name and Number of Files. Click on any bar in the chart, or any line in the table, to navigate to a file search results page listing the corresponding files. |
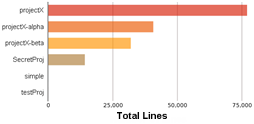
| lines per project |
Shows the total lines
analyzed in the most recent analysis of each project on the
hub.
The chart is a bar chart.
The table has one row per project, with two columns: Project Name and Total Lines. Click on any bar in the chart, or any line in the table, to navigate to a Metric Report displaying all analysis-level metrics computed for the corresponding analysis. |
Every Project page has table and chart shortcut links under Charts and Tables:
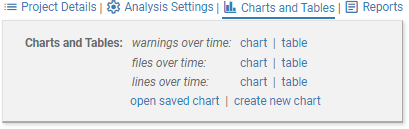
| warnings over time |
Shows the number of warnings issued for each analysis of the
project, subject to the Visible Warnings setting.
The chart is a line chart.
The table has one row per analysis, with four columns: Project Name, Analysis Name, Analysis Started, and Number of Warnings. Click on any point in the chart, or any line in the table, to navigate to a warning search results page listing the corresponding warnings. |
|---|---|
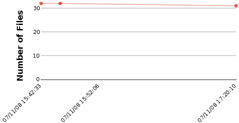
| files over time |
Shows the number of files analyzed for each analysis of the
project.
The chart is a line chart.
The table has one row per analysis, with four columns: Project Name, Analysis Name, Analysis Started, and Number of Files. Click on any point in the chart, or any line in the table, to navigate to a file search results page listing the corresponding files. |
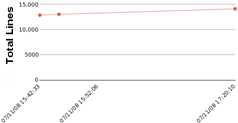
| lines over time |
Shows the total lines
analyzed for each analysis of the project.
The chart is a line chart.
The table has one row per analysis, with four columns: Project Name, Analysis Name, Analysis Started, and Total Lines. Click on any point in the chart, or any line in the table, to navigate to a Metric Report displaying all analysis-level metrics computed for the corresponding analysis. |
Every Analysis page has table and chart shortcut links under Charts and Tables:

They also have chart shortcut links under Metrics:

Links to these charts are also provided in the CodeSonar Eclipse plug-in, in the Overview tab of the Analysis Report.
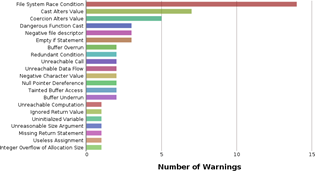
| warnings by class |
Shows the number of warnings of each class present in the
analysis, subject to the Visible Warnings setting.
Warning classes that do not occur in the analysis (or for which
all warnings are not currently visible) are not shown.
The chart is a bar chart.
The table has one row per warning class, with two columns: Warning Class and Number of Warnings. Click on any line in the table to navigate to a warning search results page listing the corresponding warnings. |
|---|---|
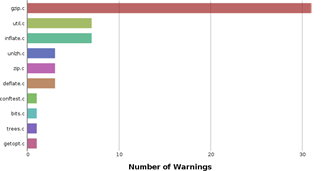
| warnings by file |
Shows the number of warnings issued in each file analyzed in
the analysis, subject to the Visible Warnings setting. Files
for which the analysis did not issue any warnings (or for which
all warnings are not currently visible) are not shown.
The chart is a bar chart.
The table has one row per warning class, with two columns: File Name and Number of Warnings. Click on any line in the table to navigate to a warning search results page listing the corresponding warnings. |
| warnings by significance |
Shows the number of warnings of each Significance issued
by the analysis, subject to the Visible Warnings setting.
Significance values not represented in the warnings issued by
the analysis(or for which all warnings are not currently
visible) are not shown.
The chart is a bar chart.
The table has one row per warning class, with two columns: Significance and Number of Warnings. Click on any line in the table to navigate to a warning search results page listing the corresponding warnings. |
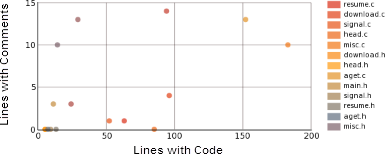
| file comment density |
The chart is a scatterplot with Lines With Comments on the Y
axis, Lines with
Code on the X axis, and one point per source file in the
analysis. (The report link is to a metric
report shortcut).
Click on any point in the chart to navigate to a metric report page showing Lines with Code and Lines with Comments for the corresponding source file. |
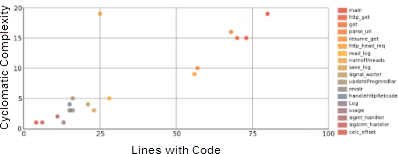
| procedure complexity |
The chart is a scatterplot with Cyclomatic Complexity on the Y
axis, Lines with
Code on the X axis, and one point per procedure encountered
by the analysis. (The report link is to a metric
report shortcut).
Click on any point in the chart to navigate to a metric report page showing Lines with Code and Cyclomatic Complexity for the corresponding procedure. |
CodeSonar permissions apply to charts (and therefore to chart tables) as follows.
| Contents |
The information included in a chart depends on the user's
permissions for the various resources involved.
|
|---|---|
| Saving |
If a user attempts to save
a chart with name N, behavior depends on whether or not the
user has SAVEDCHART_EXISTS permission for any
existing saved chart C with the same name N. If there are
multiple such charts, CodeSonar considers only the most
recently modified one.
|
| Existence | Lists of charts will only include charts for which the user
has SAVEDCHART_EXISTS permission. Note that the special chart shortcuts provided in the GUI are always visible: they are unsecurable resources. |
| Viewing | Users can only preview and open saved charts for which they have SAVEDCHART_READ permission. |
| Deleting | Deleting a saved chart requires SAVEDCHART_EXISTS and SAVEDCHART_DELETE permission for that chart. |
To report problems with this documentation, please visit https://support.codesecure.com/.