JavaScript is not currently enabled, but is required for full CodeSonar manual search and browse functionality.
If you are viewing this file in your hub's Web GUI, enable JavaScript in your browser: you will also need it for GUI functionality.
If you opened this file directly from disk, your browser may be directly suppressing JavaScript functionality: certain browsers perform this suppression on local files (but not files delivered by web servers) for security reasons.
| CodeSonar® 9.2p0 | CONFIDENTIAL | CodeSecure Inc |
This page provides access to an interactive Python interpreter running within the analysis process. Code executed in the interpreter has full access to the program representation information generated by the analysis.
Use the Python Console to develop and debug your Python plug-ins, and to interactively examine program information using the Python Plug-in API.
CodeSonar also ships with a plug-in that, when enabled, opens an interactive Python console while the analysis is in progress. For more information, see Python API: Exploring The Intermediate Representation.
Warning: the Python Console is not available by default, and its use poses a grave security risk: anyone with access to the hub can execute arbitrary code in the analysis process.
The Python Console is available (when enabled) for all analyses, independent of the language or languages involved. However, note that the availability of internal representation (IR) for analyzed code depends on the code's language.
Important Note: the CodeSonar Web GUI makes extensive use of JavaScript. Make sure JavaScript is enabled in your web browser.
The hub Python Console is only available when the hub is running with debug features enabled. To enable debug features:
Once debug features are enabled, you can enable the Python Console on a per-analysis basis by setting WEB_CONSOLE=Yes in the general project configuration file. Set it back to No for subsequent analyses if you don't want the console to be available for them.
The Python Console is available (when enabled) for all analyses, independent of the language or languages involved. However, note that the availability of internal representation (IR) for analyzed code depends on the code's language.
The Python Console can be reached in any of the following ways.
| From Analysis: | Click the API Console link, then click the view link next to Python Console in the expanded section. |
|---|---|
| By URL: | http://hub_location/analysis/analysis_id-python.html |
| Output formats | none | ||
|---|---|---|---|
| Visibility Filter Applied | none | ||
| RBAC Permissions Needed |
|
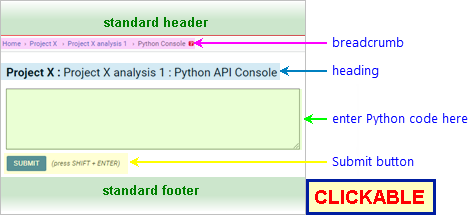
The following annotated screenshot shows the various parts of the Python Console page before any code has been entered or executed.
| Standard Header | See GUI Reference: Standard Header. |
|---|---|
| Breadcrumbs |
Home > [Other_ProjectTree_Ancestors >]
Project_Name > Analysis_Name >
Python Console
where
|
| Page Heading | Project_Name : Analysis_Name : Python API Console |
| Code Field | A text field for entering your Python code. |
| Submit button | Click to execute the specified code. Note that every time you click this button, the code in the code field is executed in a new Python session: definitions and assignments from earlier queries are not available in later queries. |
| Eval Link | [After execution only] A shortcut URL: navigate to this URL to re-execute the same code on the same analysis. |
| Output | [After execution only] The output of the executed code, if any. |
| Standard Footer | See GUI Reference: Standard Footer. |
To execute Python code in the context of a specific analysis:
CodeSonar will execute your code and display any output on the Python Console page, as in the following example. The page contents are expanded to include an eval link and the output of the executed code.

The table below includes some simple Python expressions, along with some examples using CodeSonar API functions.
| Query | Result | Notes |
|---|---|---|
def factorial(n):
        return 1 if n==0 else n * factorial(n-1)

print(factorial(10))
|
3628800 | Define and use function factorial(). |
print(factorial(5)) |
NameError | The definition of function factorial() was in a separate Python session; there is no definition in this session. |
import cs
m = cs.project_metricclass_manager.metricclasses()
print(', '.join([cl.tag() for cl in m]))
|
LCom, TL, LCodeOnly, LB, LMCC, LComOnly, InclF, LCode, S1, Modules, TopLF |
Get the analysis-granularity
metric
classes computed by the analysis; print all their tags.
Note that the set of metric classes will depend on the analysis configuration. |
import cs
for c in cs.project.current().compunits():
    print(c.name())
|
(a list of file paths) | Print the paths of the root file instances for all the compilation units in the current project. |
To report problems with this documentation, please visit https://support.codesecure.com/.