JavaScript is not currently enabled, but is required for full CodeSonar manual search and browse functionality.
If you are viewing this file in your hub's Web GUI, enable JavaScript in your browser: you will also need it for GUI functionality.
If you opened this file directly from disk, your browser may be directly suppressing JavaScript functionality: certain browsers perform this suppression on local files (but not files delivered by web servers) for security reasons.
| CodeSonar® 9.2p0 | CONFIDENTIAL | CodeSecure Inc |
This page allows users to interactively explore the possible execution paths to a warning or code location.
The Explore Callers page type is available for analyzed C/C++ code only.
Important Note: the CodeSonar Web GUI makes extensive use of JavaScript. Make sure JavaScript is enabled in your web browser.
An Explore Callers page can be reached in any of the following ways.
| From... | Action | Page Mode |
|---|---|---|
| Warning
Report Extended Warning Report |
Expand the warning details section and click graphical (lite) (on the Explore Callers line). | Warning |
| Search Callers results | Click graphical (lite) (on the View Path line) in an expanded path entry. | Matches the Search Callers page mode. |
| Information
Window (on any applicable page) |
Click the graphical (lite)
link under the Call Tree label. (Will be present on function call sites and function entry points.) |
Ordinary |
| Click the graphical (lite)
link under the <token> is tainted [...] Find
Source label. (Will be present for tainted tokens.) |
Taint | |
| Click a graphical (lite)
link under the <token> is tainted [...] Check
Taint in Warning Context label. (Will be present for tainted tokens in Warning Reports and in the Line Content column of any table of warnings.) |
Taint+Warning |
| Output formats | none | ||
|---|---|---|---|
| Visibility Filter Applied | none | ||
| RBAC Permissions Needed |
|
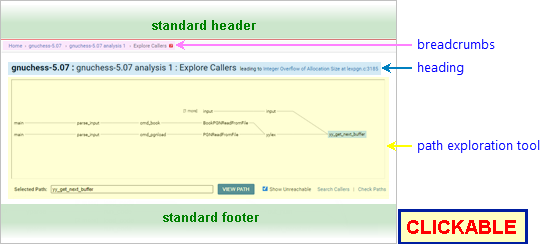
The following annotated screenshot shows the various parts of an Explore Callers page.
See CodeSonar GUI Reference: Standard Header.
Home > [Other_ProjectTree_Ancestors >] Project_Name > Analysis_Name > Warning Warning_ID > Explore Callers
Where
Home : Analysis_Name : Explore Callers leading to <location/mode>
Where <location/mode> is a short descriptive string that depends on the page mode.
| Page Mode | <location/mode> string |
|---|---|
| Ordinary | Func_Name at File_Name:line_num with a link to line line_num in the source listing for file File_Name. |
| Taint | Taint at token |
| Warning | Warning_Class at
File_Name:line_num with a link to the corresponding Warning Report. |
| Taint+Warning | Warning_Class at File_Name:line_num /
Taint at token with a link to the corresponding Warning Report. |
The path exploration tool has two parts. The upper panel contains a function call graph, with the currently-selected path highlighted. Callers appear to the left of callees. Below the call graph panel are tools providing further operations on the selected path.
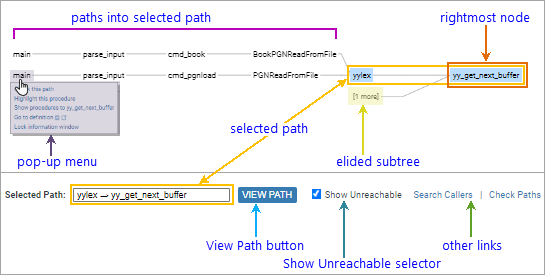
| selected path |
The nodes in the currently-selected path are highlighted in
blue. Click any procedure name on the graph to select it as the
start point of the path.
The Selected Path text field is automatically updated to reflect your selections; it cannot be edited directly. |
||||||||||
|---|---|---|---|---|---|---|---|---|---|---|---|
| elided subtree |
For space reasons, unselected subtrees may be elided and
replaced with annotations of the form [N more]. This annotation
indicates that N callers of the following node, and all
the paths into those callers, have been elided from the tree.
Click [N more] to expand the subtree and select the node to the right of the subtree as the start point of the path. |
||||||||||
| rightmost node | The rightmost node in the displayed depends on the current page mode. | ||||||||||
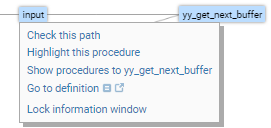
| pop-up menu |
Right-click any call tree node to open a pop-up menu for that
node.
|
||||||||||
| View Path button |
Click to open a new GUI page showing the selected path. The
type of page that will open depends on the current page mode.
|
||||||||||
| Show Unreachable selector |
Behavior depends on the setting of configuration parameter
REACHABILITY_ROOTS.
|
||||||||||
| other links |
Click Search Callers
to open a Search Callers
page for the warning.
Click Check Paths to check every visible call graph path. For full details, see Checking Paths: Explore Callers. |
||||||||||
| information window | The information window is available on this page. Hover over a node in the graph to display information about the corresponding procedure. |
See CodeSonar GUI Reference: Standard Footer
Depending on the context in which you navigated to the Explore Callers page, it will be in one of four modes.
| Mode | Additional Functionality |
|---|---|
| Ordinary |
The rightmost node in the displayed call graph is the function
noted in the page heading.
Path checking is not applicable:
|
| Taint |
The rightmost node in the displayed call graph is the function
containing the token occurrence location noted in the page heading.
|
| Warning |
The rightmost node in the displayed call graph corresponds to
the first procedure in the warning's core path.
The remainder of the core path (if any) is not explicitly
displayed.
|
| Taint+Warning |
The rightmost node in the displayed call graph corresponds to
the first procedure in the warning's core path.
The remainder of the core path (if any) is not explicitly
displayed.
|
| navigate to the search callers page for this warning | Click the Search Callers link in the path exploration tool. |
|---|---|
| view the standard warning report | Click the warning ID in the page breadcrumbs. |
| view the selected path in an extended warning report | Click the View Warning button in the path exploration tool. |
| view the side by side code listings for the selected path | Click the Show procedures to procname link in the pop-up menu |
| view a source listing (scrolled to a procedure definition) | Right-click a graph node corresponding to that procedure and select Go to Definition from the pop-up menu that opens. |
| view parent analysis information | Click the analysis name in the page breadcrumbs. |
| view parent project information | Click the project name in the page breadcrumbs. |
To report problems with this documentation, please visit https://support.codesecure.com/.
 Display in a