
JavaScript is not currently enabled, but is required for full CodeSonar manual search and browse functionality.
If you are viewing this file in your hub's Web GUI, enable JavaScript in your browser: you will also need it for GUI functionality.
If you opened this file directly from disk, your browser may be directly suppressing JavaScript functionality: certain browsers perform this suppression on local files (but not files delivered by web servers) for security reasons.
| CodeSonar® 9.2p0 | CONFIDENTIAL | CodeSecure Inc |
Many CodeSonar GUI pages include tables. This section describes the common table functionality for CodeSonar.
For the majority of tables, clicking a row will navigate to a GUI page providing more information about the entity described in that row. The GUI reference entry for each page type will describe the navigation behavior for any table or tables in the page. Table rows in some page types provide additional functionality, for example for setting warning properties in Warning Search Results and Analysis: Warnings pages: again, see the individual GUI reference entries for full details.
Standard browser functionality can be used to open the new GUI page in a new tab or window. If a link is opened with Ctrl-click or Shift-click, the corresponding table row will be highlighted until another table row is clicked.
If you have already viewed the GUI page linked from an individual table row, the row contents will be rendered in a lighter color to indicate a visited link.
Users have full control over the columns displayed in tables: which columns are displayed, the order in which they are displayed, and how they are sorted.
Every table column has an associated column management menu. To open the menu, click on the column heading. The screenshot fragment below shows a typical column management menu.
| Sort Ascending |
Sort the table rows by the value in this column, in ascending
order.
Sorting is cumulative: sorting a table by column A and then by column B will result in a table whose rows are sorted by B, and within in each B value by A. Table redisplay may be noticeably slowed when performing new sorts on large tables that have already undergone several cumulative sorting operations. A marker will be displayed in the column heading if the rows
are currently sorted by that column: |
||||||||||||||||||||||||||
|---|---|---|---|---|---|---|---|---|---|---|---|---|---|---|---|---|---|---|---|---|---|---|---|---|---|---|---|
| Sort Descending |
Sort the table rows by the value in this column, in descending
order.
Sorting is cumulative: see the note above. |
||||||||||||||||||||||||||
| Move Left | Move this column one place to the left. This option is not available if the column is already the leftmost one in the table. | ||||||||||||||||||||||||||
| Move Right | Move this column one place to the right. This option is not available if the column is already the rightmost one in the table. | ||||||||||||||||||||||||||
| Reset Table | Change all the table settings back to the factory defaults. This affects the table sort order, the visibility and placement of table columns, and the number of lines shown per page. This option is only available if table settings are not already at the factory defaults. | ||||||||||||||||||||||||||
| Chart |
This menu item is only available on columns that can be
charted. The chart produced will be a bar chart, with contents
that depend on the type of table and the column selected.
|
||||||||||||||||||||||||||
| Hide |
Do not display this column.
If you hide a column and then decide you want it back, use the Show sub-menu. |
||||||||||||||||||||||||||
| Show > |
To display a currently hidden column, select its name from the
Show sub-menu. The columns
available on the sub-menu depend on the page type and the
currently displayed columns.
There are two special items:
|
To specify table properties in the page URL, use the CodeSonar HTTP API.
The CodeSonar HTTP API allows you to construct HTTP queries to access and download warnings, analyses, and other hub content. HTTP API documentation is served directly by the hub, and cannot be accessed via a file:// URL. To view, start a hub (if one is not already running), then open the following URL.
Where http://host:port is your hub homepage URL (for HTTPS hubs, the URL will start with https://).
Controls at the top and bottom right of the table provide pagination information and functionality.

The following annotated screenshot describes the individual pagination controls.
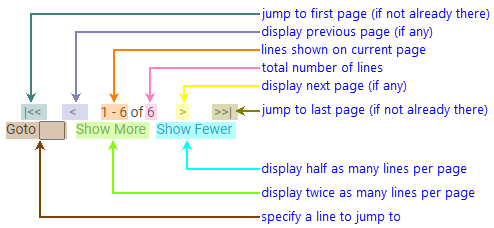
| |<< | Display the first page of the table. If the first (or only) page is currently displayed, this option is not available. |
|---|---|
| < | Display the previous page of the table. If the first (or only) page is currently displayed, this option is not available. |
| Current Lines | The table lines displayed on the current page of the table, as a range. |
| Total Lines | The total number of lines in the table (across all pages). |
| > | Display the next page of the table. If the last (or only) page is currently displayed, this option is not available. |
| >>| | Display the last page of the table. If the last (or only) page is currently displayed, this option is not available. |
| Goto |
Enter a number in the text field and press return to display a page of the table starting
from the specified line.
|
| Show More | Change the pagination to display twice as many lines per page. If all lines currently fit on a single page, this option is not available. |
| Show Fewer | Change the pagination to display half as many lines per page. If only one line per page is currently displayed, this option is not available. |
CodeSonar will remember each user's preferred number of table lines per page as established through the use of "Show More" and "Show Fewer". For signed-in users, this information is stored as a user preference; otherwise the information is lost when the session expires.
To report problems with this documentation, please visit https://support.codesecure.com/.