JavaScript is not currently enabled, but is required for full CodeSonar manual search and browse functionality.
If you are viewing this file in your hub's Web GUI, enable JavaScript in your browser: you will also need it for GUI functionality.
If you opened this file directly from disk, your browser may be directly suppressing JavaScript functionality: certain browsers perform this suppression on local files (but not files delivered by web servers) for security reasons.
| CodeSonar® 9.2p0 | CONFIDENTIAL | CodeSecure Inc |
CodeSonar provides HTML versions of analysis results and warning reports. This allows easy result browsing as well as a high degree of portability for warning reports.
Important Note: the CodeSonar Web GUI makes extensive use of JavaScript. Make sure JavaScript is enabled in your web browser.
In the previous step you built a project, ran the CodeSonar analysis and sent the analysis results to a hub. Now you can view the analysis report.
The analysis may still be under way when you open the analysis page. If this is the case, the page will not be fully populated and the Analysis State bar will not be full. Reload the page to see updated results. Once the analysis is completed, the Analysis State bar will be full and will contain the word Finished.
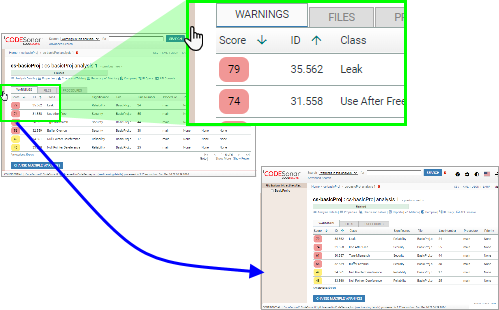
You should see a page that looks (something) like this:
![]()
This is the analysis page. By default, it will display the Warnings tab, which contains a table of all the warnings issued by the analysis. (The values in the ID column may differ from those shown here.)
The bar will expand to display the File Explorer. If you select a file in the File Explorer, the contents of each Analysis page tab will update to show only the warnings (or files, or procedures) from that file. If you select a directory, the tabs will show the warnings (files, procedures) from the tree under that directory. This is particularly useful for large projects with many source files and directories. This project only has one file, so you don't need to keep the File Explorer open.
You will see at a glance that the analysis of BasicProj.c produced several warnings, including two Null Pointer Dereference warnings.
Each warning has an associated numerical Score. CodeSonar computes and reports this in order to suggest a review order for warnings: warnings with a higher Score value before warnings with a lower Score value.
We will review a "Null Pointer Dereference" warning first, even though it doesn't have the highest Score, because it provides a useful introduction to several Warning Report features.
This will open a new page.
In overview, the warning report page looks (something) like this:

The report heading specifies the warning class of the warning, and the location (file and line number) where the warning was issued. The location is a link: you can click it to navigate to the warning location in the source excerpt. Directly underneath the heading is a Jump to warning location ↓ link, which has the same destination.
Context-sensitive help links ![]() are provided throughout the CodeSonar
GUI.
are provided throughout the CodeSonar
GUI.
Click warning details in the report heading to see detailed information about the warning.

| Categories | The warning is associated with warning mnemonic LANG.MEM.NPD,
CWE identifiers CWE:476 and CWE:690, and SEI CERT C
Coding Standard rule EXP34-C. Each category name links to a documentation page: warning mnemonics are documented in this manual, CWE identifiers are documented at the CWE website, and CERT rules and recommendations are documented at the CERT website. |
|---|---|
| Warning ID | Uniquely identifies the warning to the hub. The number before the dot is the Group ID for the warning group this warning belongs to. The number after the dot is the Instance ID and is unique to this warning instance. |
| Procedure | The warning was issued in procedure main. |
| Explore Callers | CodeSonar provides functionality for interactively exploring the possible execution paths to a warning location. To learn more, see GUI Reference: Explore Callers. |
| Modified | The last time the warning report was modified. At the moment, this is just the time that the report was issued. |
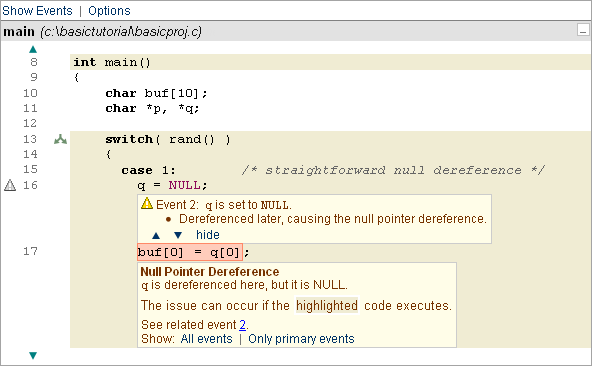
The warning report displays an annotated excerpt from the source file in which the warning was issued.
| excerpt header | Gives the full path name of the source file and provides Show Events and Options menus. |
|---|---|
| excerpt |
The source excerpt is colored and annotated. In particular:
|
| warning description box | An annotation at the warning location specifies the warning class and explains that the problem is that q is dereferenced at line 17, when its value is NULL. |
| primary event | CodeSonar has determined that the code at line 16 is especially important – a primary event – because it is the origin of the NULL value for q. The annotation for Event 2 is therefore displayed by default. This is a data annotation and has a yellow background. |
CodeSonar displays annotations for primary events by default. Sometimes you will want to see the remaining annotations as well.
This warning has one other annotation, noting that the rand() call at line 13 returns 1 in the execution being considered. The return value affects control flow through the program, so the event has a control flow annotation with a green background.
![]()
You can also view all annotations by selecting All events from the Show Events menu at the top of the excerpt.
CodeSonar has concluded that if this path is followed, q must be a null pointer and so buf[0] = q[0] must be a null dereference. This is a feasible path, because there is no reason to assume the rand() call can't return 1.
This first warning was straightforward: q is set to NULL and then dereferenced whenever rand() returns 1. It's useful for illustrating the basics of CodeSonar but is an unlikely error for a programmer to make. Even if this bug did somehow find its way into a program it would quickly cause problems and easily be found using basic debugging methods.
To report problems with this documentation, please visit https://support.codesecure.com/.